Commerce Ops Dashboard
E-commerce operations SaaS, Hong Kong
Concept studyAn illustrative concept showing the kind of work we do, not a client engagement.
- Services
- Web app, Backend & API, Product design, AI integration
- Tech
- Next.js, TypeScript, PostgreSQL, Redis, Claude API
- Region
- Hong Kong · 2024
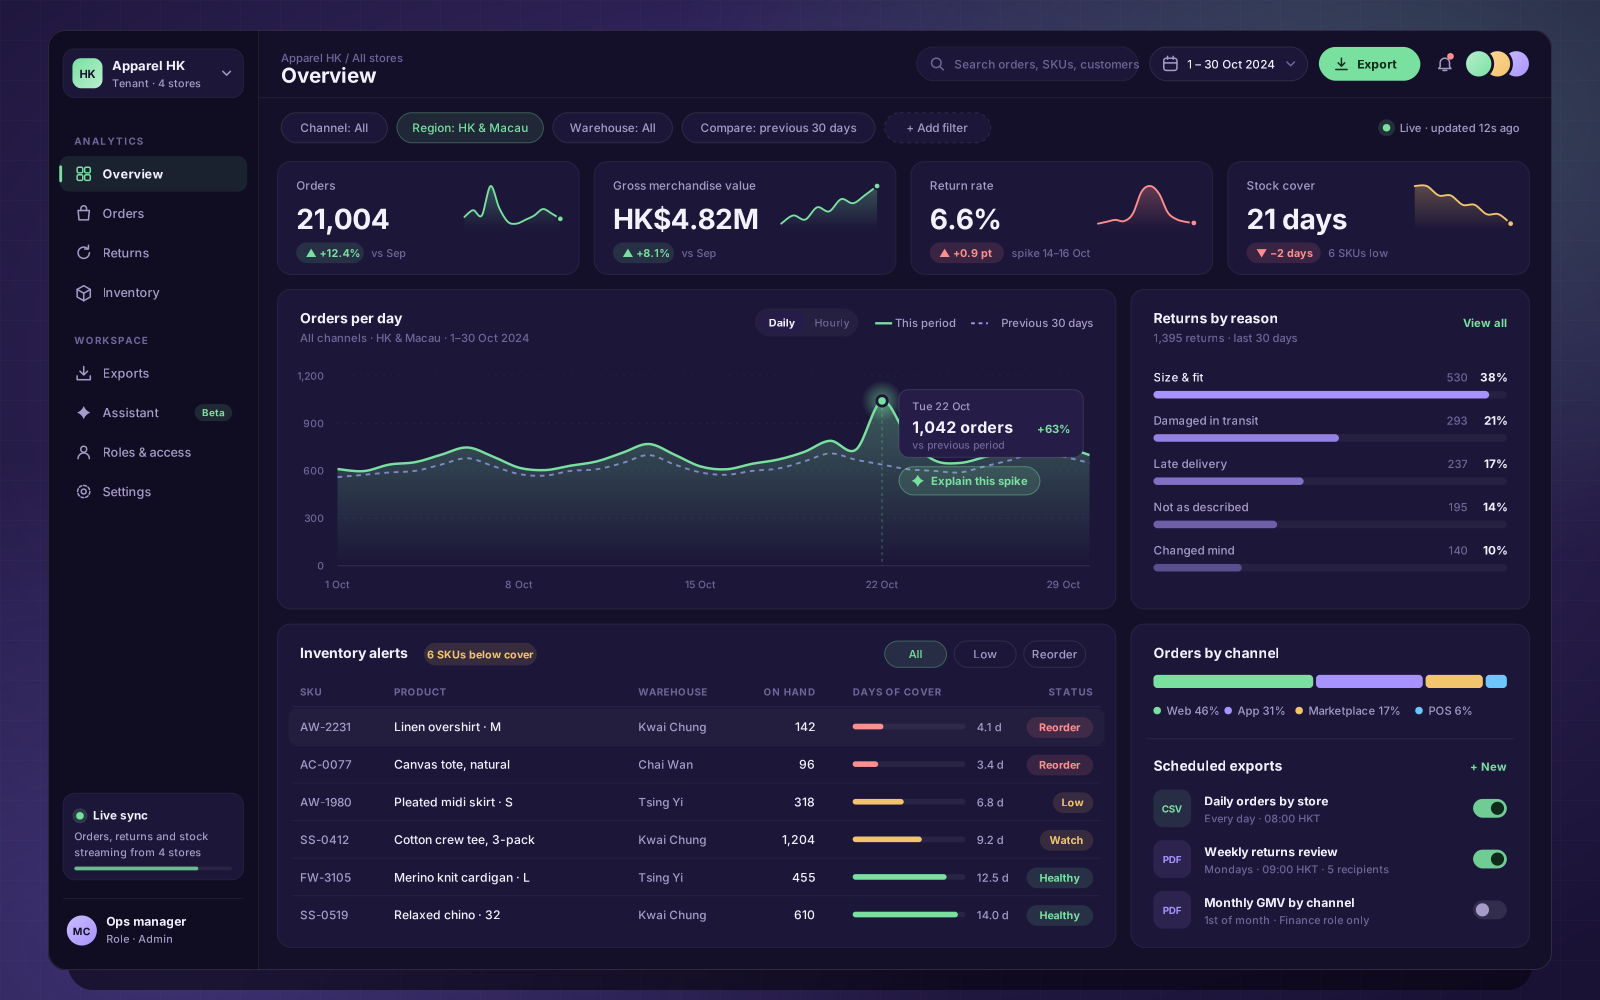
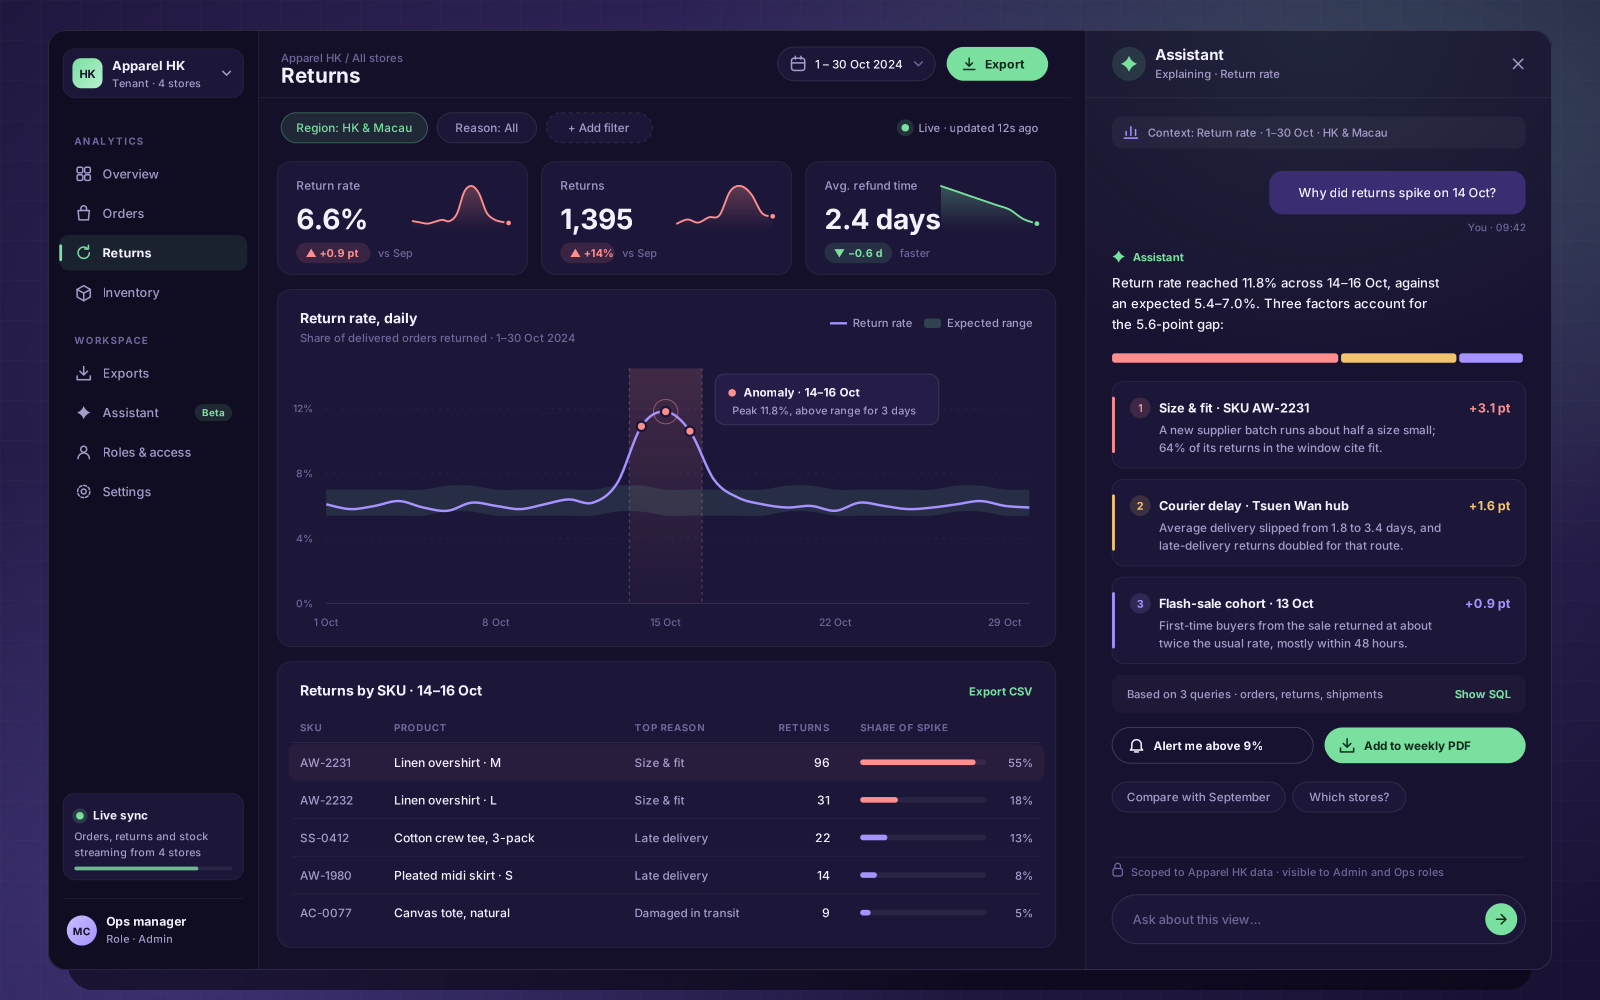
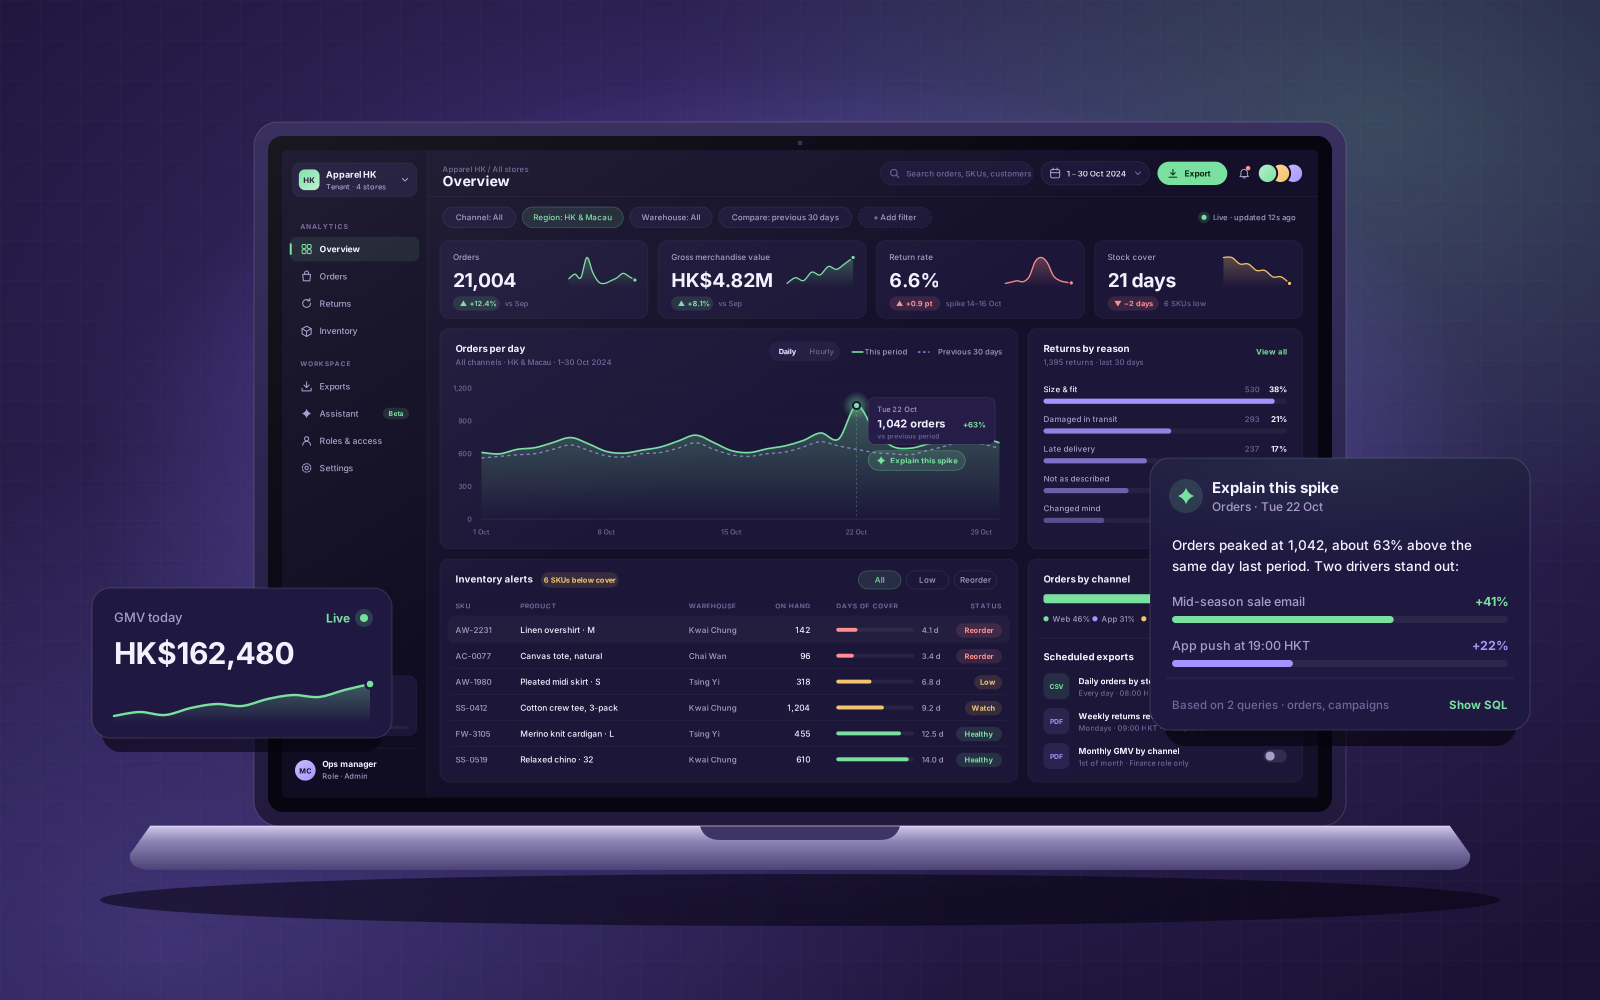
E-commerce operations teams were stitching orders, returns and stock levels together from spreadsheet exports, so a spike was usually noticed days after it mattered. We built a multi-tenant analytics dashboard on Next.js and PostgreSQL with live order, returns and inventory charts, role-based access per store and team, scheduled PDF and CSV exports, and an assistant that explains any spike in plain language and shows the queries behind its answer. We designed and shipped it in short iterations, using AI-assisted tooling for scaffolding, query tuning and test coverage while every change still went through human review.
- Duration
- 6 months, ongoing
- Engagement
- Dedicated team
- Platforms
- Web · Admin console
- Status
- Live
What we built
Live order, returns and inventory charts with channel, region and warehouse filters
Multi-tenant data isolation with role-based access per store and team
Scheduled PDF and CSV exports delivered automatically to chosen roles
AI assistant that explains spikes and shows the SQL behind each answer
Approach
We started with one pilot tenant, rebuilding its weekly spreadsheet reports as dashboards so the ops managers could check every number against figures they already trusted. Automated tests verify tenant isolation on every release, and the assistant's answers are compared with hand-written queries before any new prompt version ships.